Graph Drawing Contest
Prague, September 17-20, 2019

The 26th Annual Graph Drawing Contest was held in conjunction with the 27th International Symposium on Graph Drawing and Network Visualization (GD 2019).
Following the tradition of the past years, the Graph Drawing Contest was divided into two parts: the Creative Topics and the Live Challenge.
Creative topics were comprised by two data sets. The first data set described appearances of superheroes in the Marvel Cinematic Universe movie. The second data set was comprised by occurrences of ingredients in popular meals. The data sets were published a year in advance, and contestants submitted their visualizations before the conference started. Submissions were evaluated according to aesthetic appeal, domain-specific requirements, readability and clarity of the visualization and novelty of the visualization concept. For details, see here.
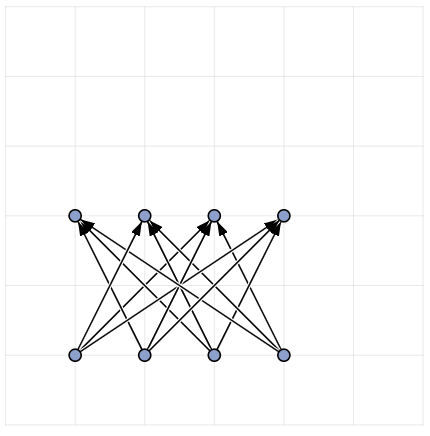
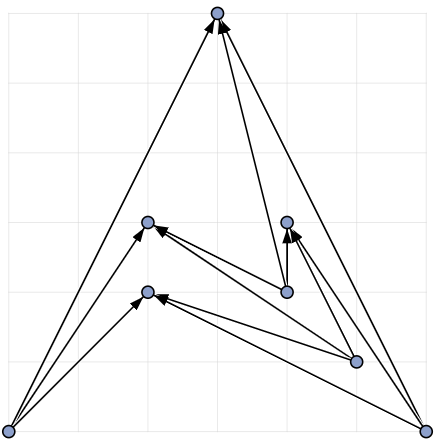
The live challenge took place during the conference in a format similar to a typical programming contest. Teams were presented with a collection of challenge graphs and had one hour to submit their highest scoring drawings. This year’s topic was to minimize the number of crossings an upward straight-line drawing of a graph with vertex locations restricted to a grid. For details, see here.
Overall, we received 29 submissions: 10 submissions for the creative topics and 19 submissions for the live challenge.
Creative Topics: Marvel Cinematic Universe
Creative Topics: Meal Ingredients
Live Challenge: Manual Category
Live Challenge: Automatic Category
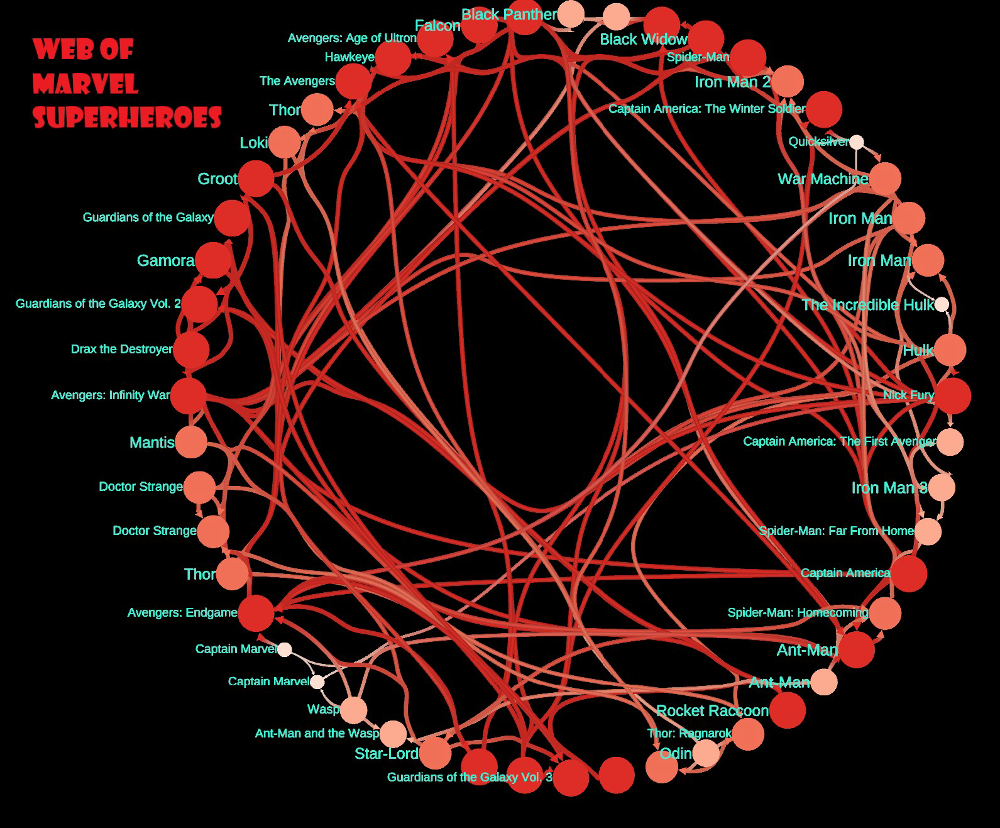
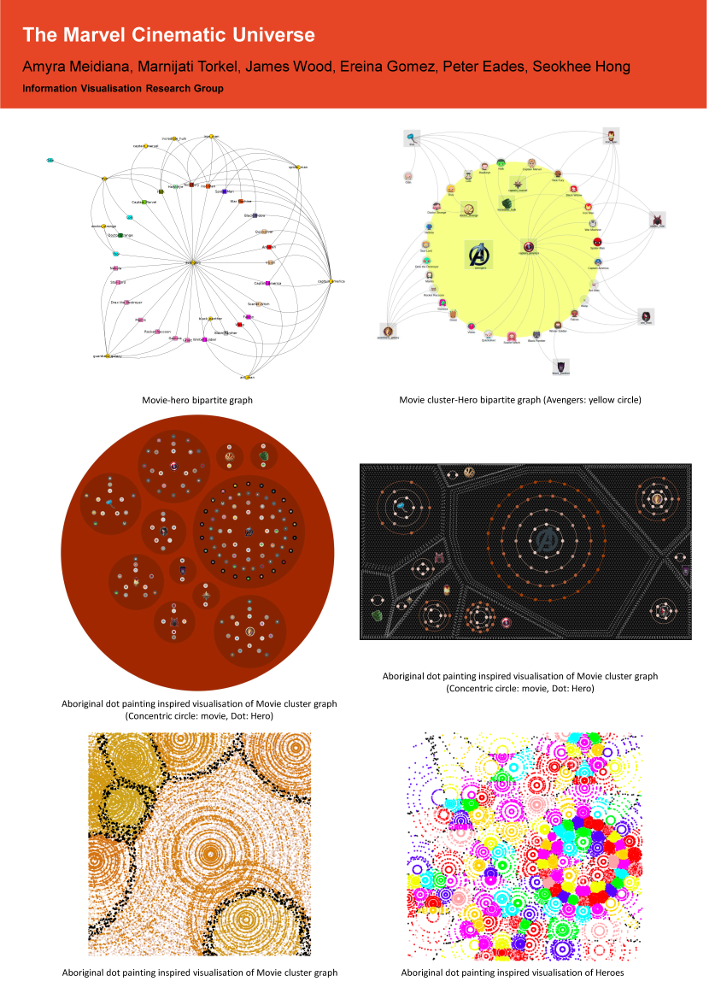
The Marvel Cinematic Universe is a media franchise and shared universe that is centered on a series of superhero films, based on characters that appear in comic books published by Marvel. The data set describes a selection of 28 characters (heroes) and in which of the 24 movies released so far they appeared. The data was compiled from the Marvel Cinematic Universe Wiki.
We received 6 submissions for this category. We selected 3 winning submissions, which were printed on large poster boards and presented at the Graph Drawing Symposium. We will now first present the submissions that unfortunately did not make the top 3.
We will now present the top 3 submissions.
3rd Place:
Velitchko Filipov, Alessio Arleo, Davice Ceneda, and
Silvia Miksch (TU Vienna)
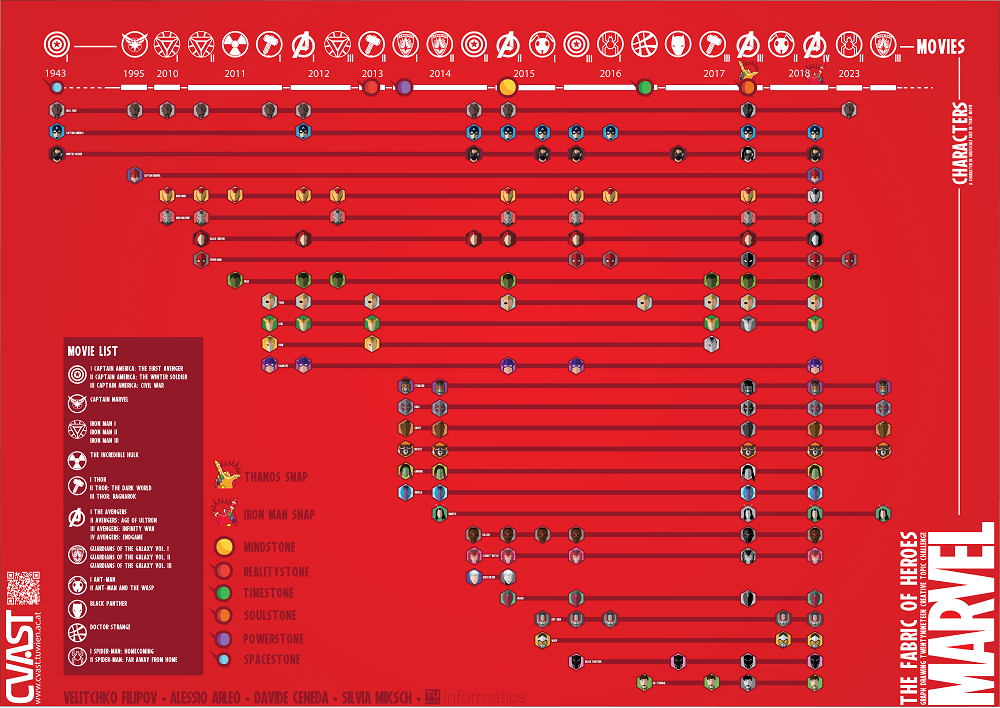
The committee appreciated the extensive use of glyphs, the use of the non-provided information on when the movies were filmed, the clarity, the minimalistic style, and the aesthetics of the visualization.
2nd Place:
Markus Wallinger (TU Vienna)
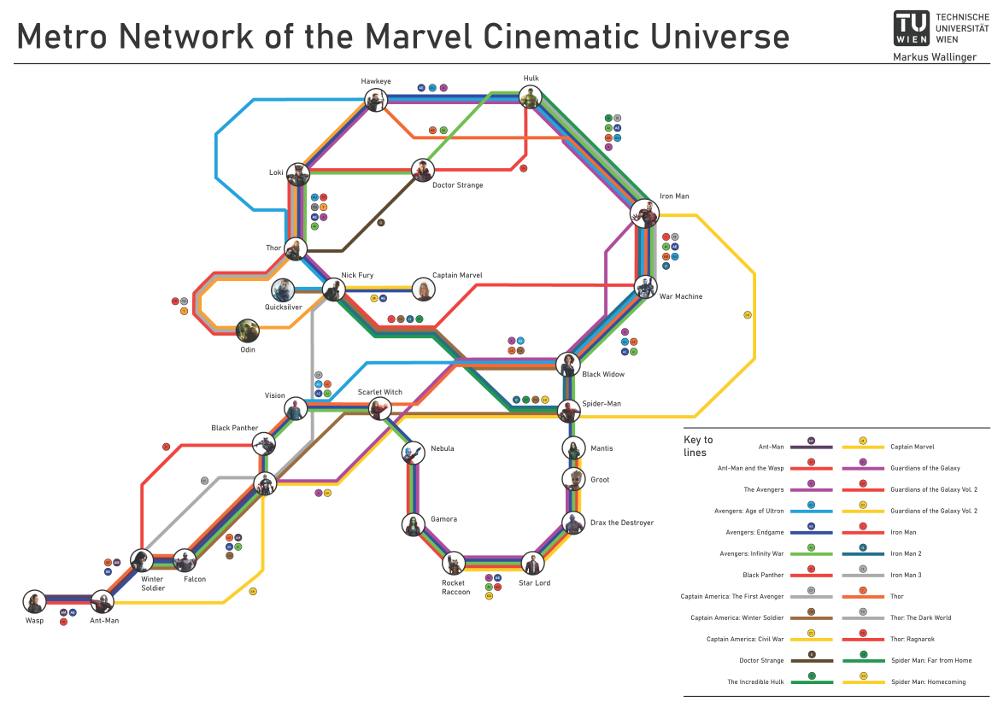
The committee valued the choice of the metro-map visualization metaphor, the well-constructed layout, the use of glyphs. On the other hand the committee observed that the visualization would gain in readability from a better choice of color palette and from the selective use of text labels on the lines.
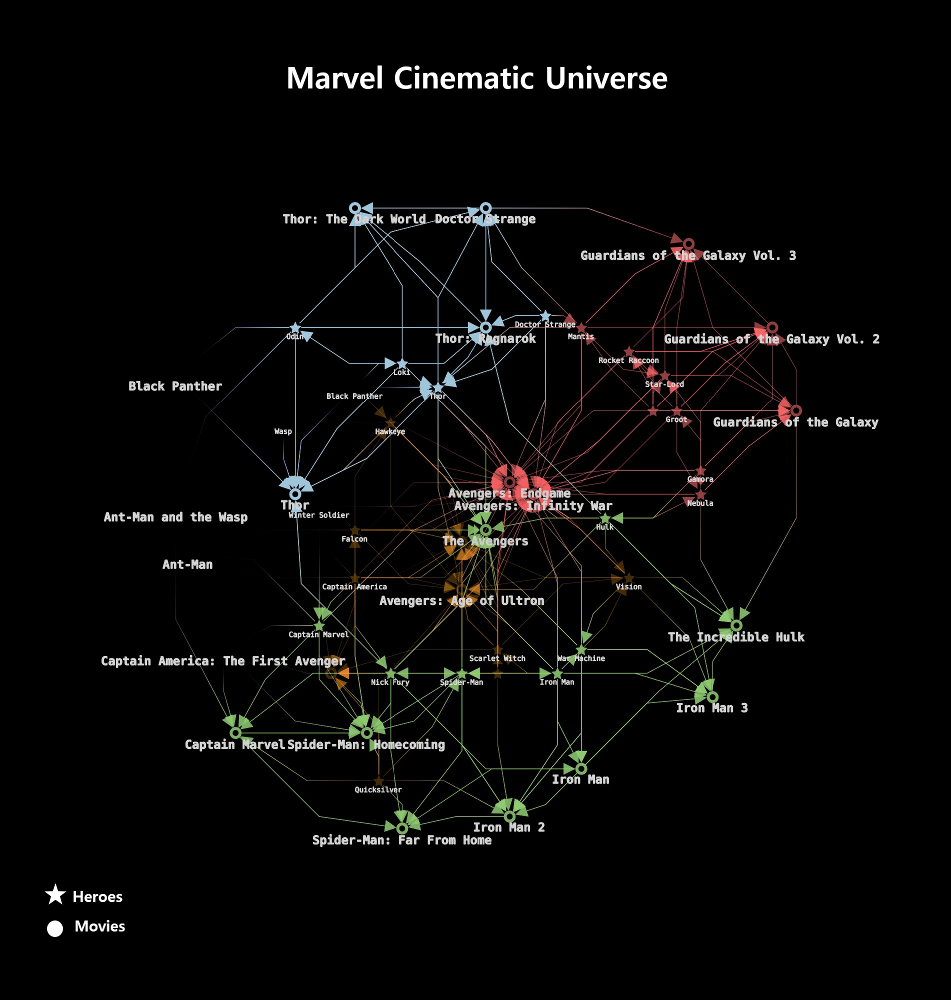
1st Place:
Evmorfia Argyriou, Christian Brunnermeier, Anne Eberle, and Johannes Rössel (yWorks)
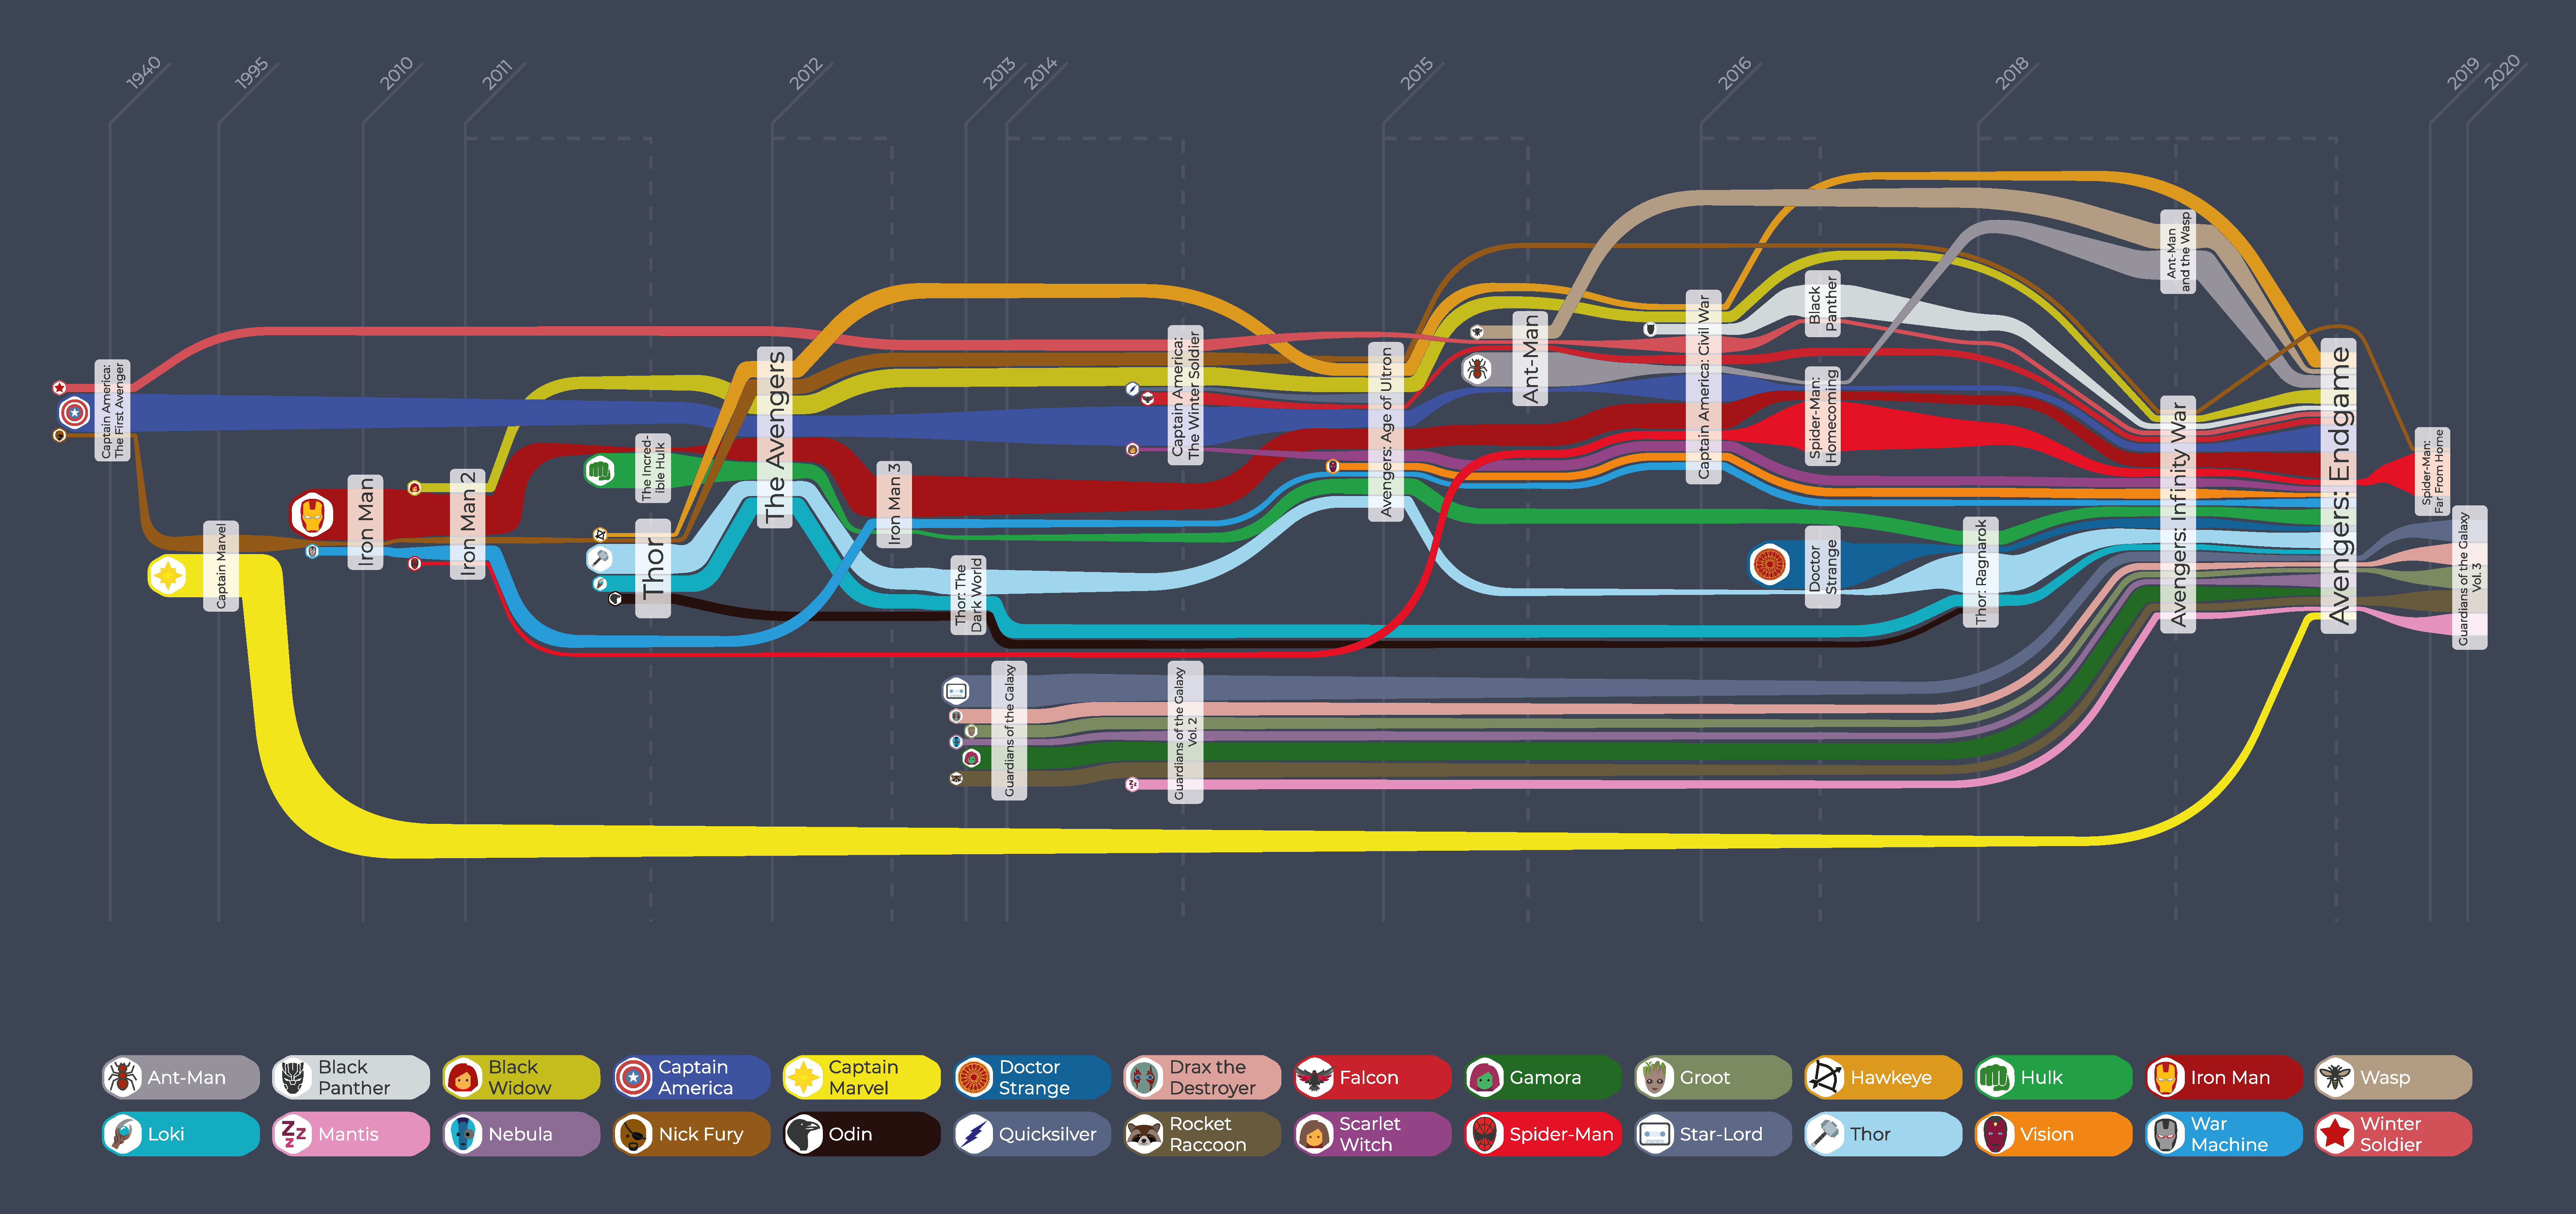
The committee especially valued the minimalism and the clarity of the presentation, the choice of the hierarchical layout resembling Sankey diagrams, the use of the non-provided information such as the timeline and the screen time, the choice of the color pallete and the glyphs. The committee was also impressed by the design choices of the overall poster. The visualization and an explanation of the drawing process is available online.
Evmorfia Argyriou: In this visualization of the Marvel Cinematic Universe and its characters, we've arranged all movies in their in-universe timeline. Characters are shown as edges that pass through the movies they appear in. The thickness of edges models the relative screen time of characters within a movie. The overall layout is automatically computed and uses yFiles' support for Sugiyama-style graph drawing with several adjustments and enhancements for parts of the graph. The accompanying interactive application also allows to filter the graph by character or film series.
The data set describes 151 food recipes extracted from the TheMealDB database. TheMealDB was built in 2016 to provide a free data source API for recipes online. It originated on the Kodi forums as a way to browse recipes on a TV.
The provided data set consisted of three types. There were 297 food ingredients, e.g. "Beef", "Flour", "Red Wine". There were 11 areas (countries) that are popular for their dishes around the globe: "American", "British", "Chinese", "French", "Greek", "Indian", "Italian", "Japanese", "Mexican", "Spanish", "Thai". Finally, there were 151 recipes that contain a list of ingredients and belong to one area.
The task was to visualize the data either in a form of a graph or any other form the authors prefer. The authors could decide whether they omit relatively uninformative parts of the data.
We received 4 submissions for this category. We selected 3 winning submissions, which were printed on large poster boards and presented at the Graph Drawing Symposium. We will now first present the submission that unfortunately did not make the top 3.
Jirong Liu (Macquarie Group)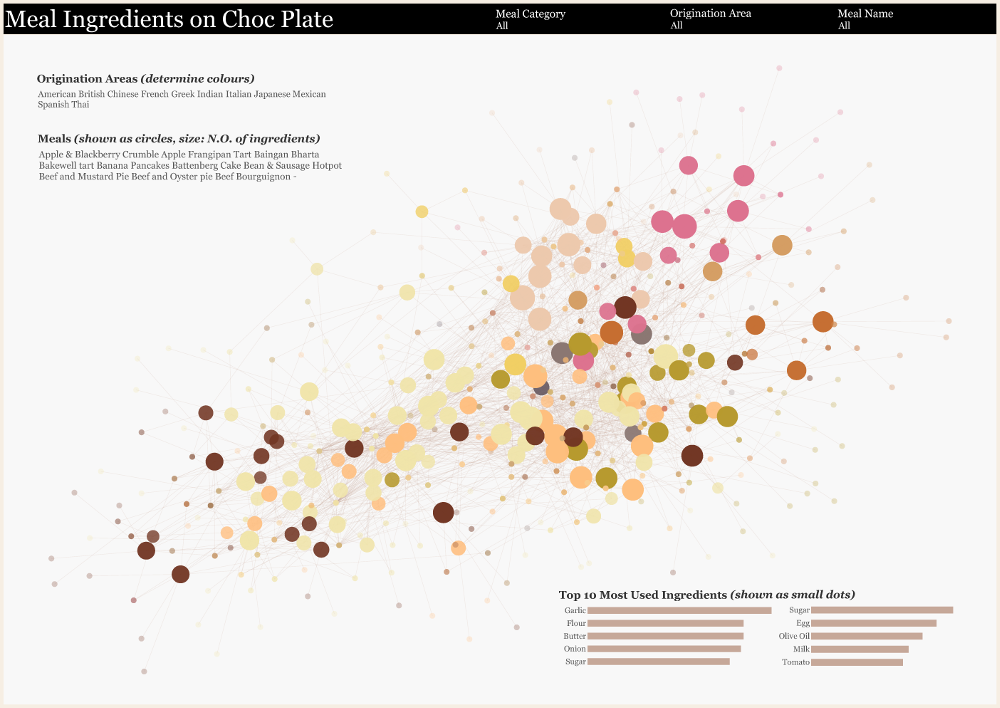
|
We will now present the top 3 submissions.
The committee noticed that the constructed graph of meals, where the edges represent shared ingredients, and the graph of ingredients, where the edges represent the number of meals using both ingredients, provide a interesting overview on the data, by revealing the clusters of similar meals and relative ingredients.
2nd Place:
Elektra Kypridemou (University of Liverpool) and Christos Rodosthenous (Open University of Cyprus)
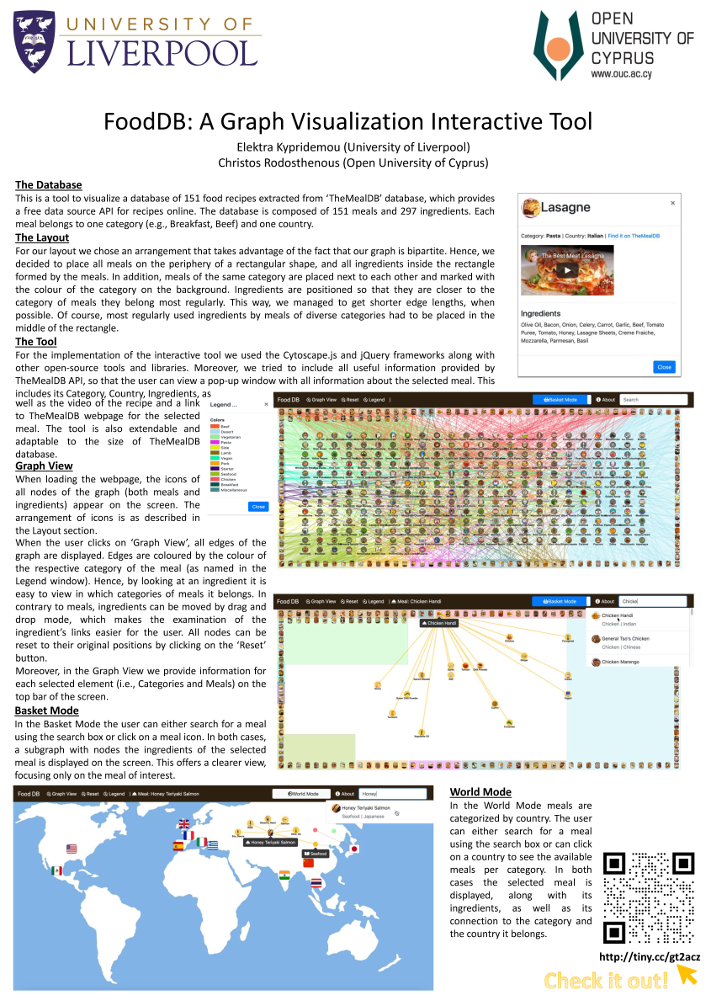
The committee appreciated the interactive design of the system which allowed to investigate the data set in details. The interactive tool is available online.
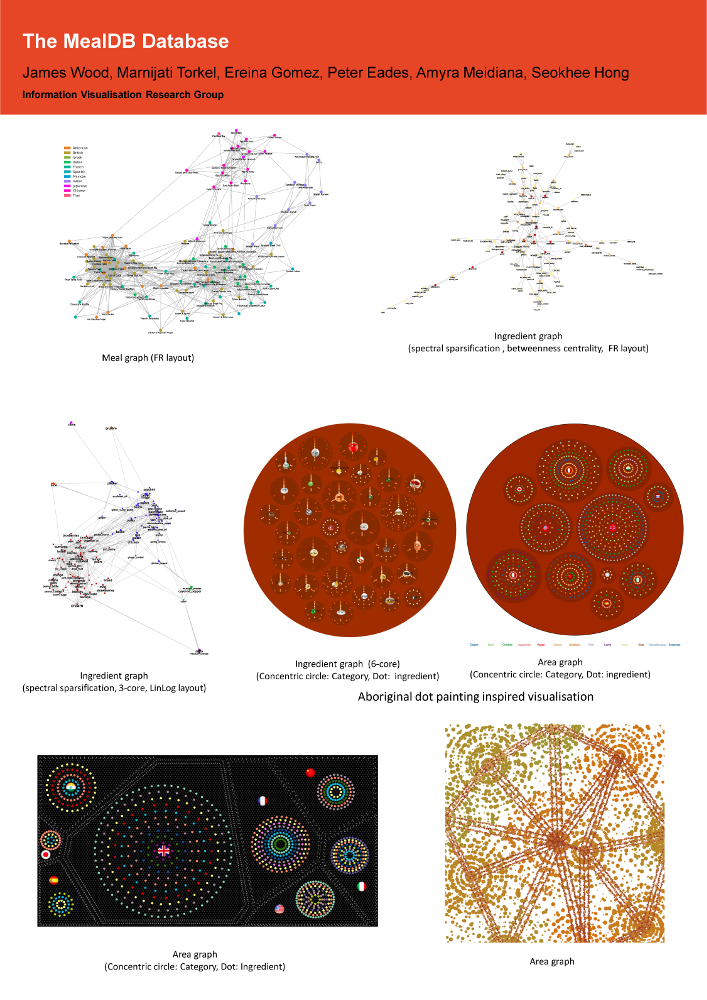
1st Place:
Guangping Li, Soeren Nickel, Martin Nöollenburg, Ivan Viola, and Hsiang-Yun Wu (TU Vienna)
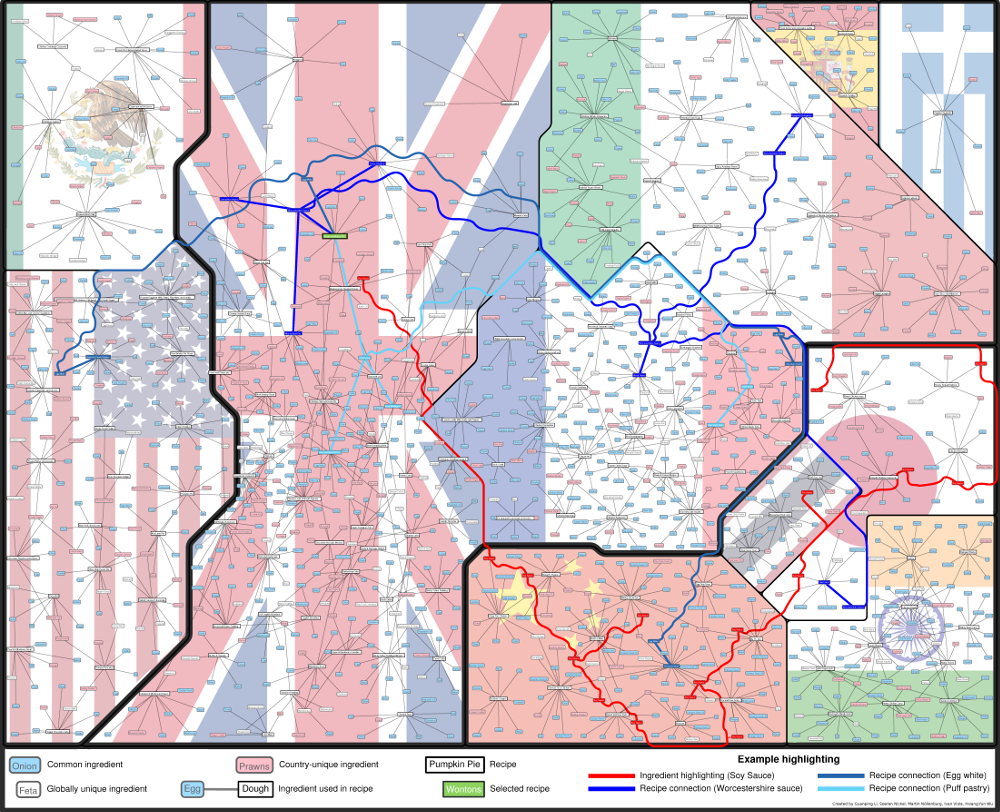
The committee valued the attempt to visualize both the details of the data set but also an overview, which was presented by showing the clusters of the meals by the country of origin. The committee also valued the idea of splitting the ingredient vertices to untangle the visualization.
Martin Nöllenburg: In our World Map of Recipes, we used a multi-level force-based algorithm to partition screen space among the countries and to harmonize the label territory. The visibility management is achieved by duplicating high-frequency ingredient nodes coupled with a spanning-tree-based visual integration. The technique automatically grouped countries sharing common ingredients in their recipes close to each other, which happened to produce continental clusters, and it visually discriminates ingredient nodes with different levels of importance. It also allows us to highlight ingredients and recipes of interest using an occlusion-free curve routing scheme.
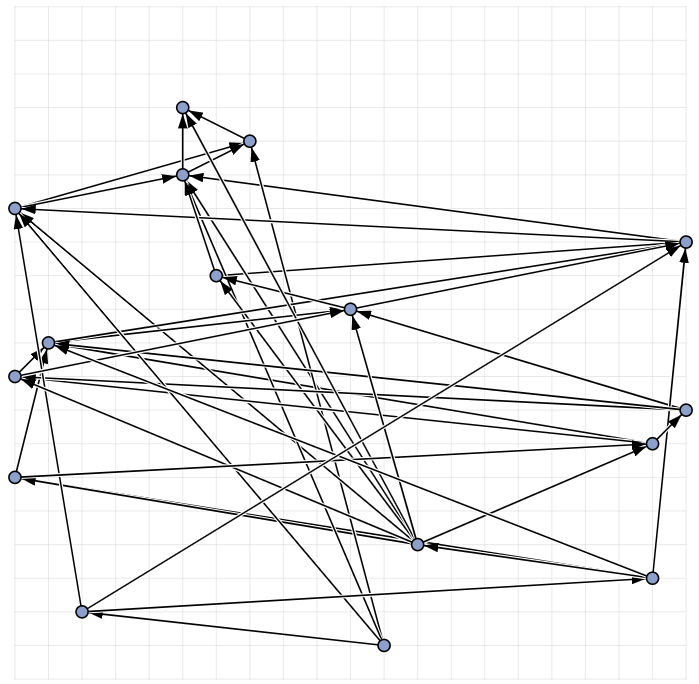
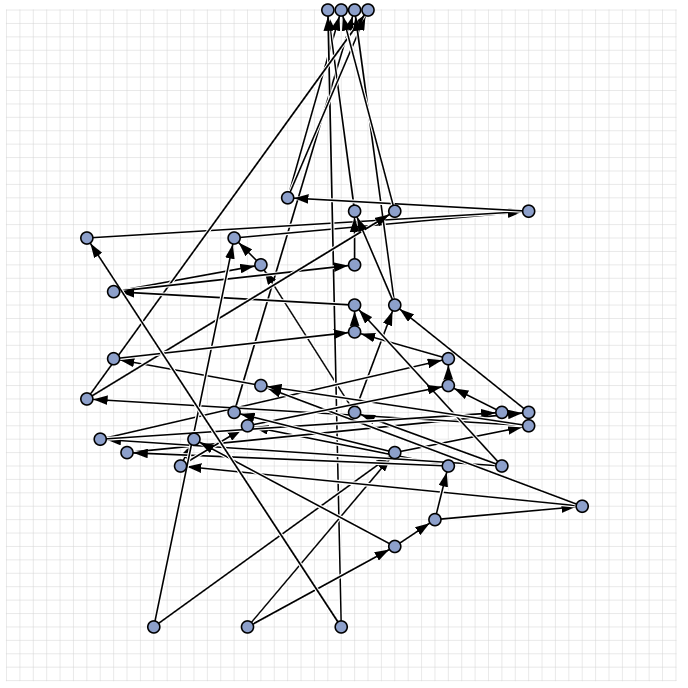
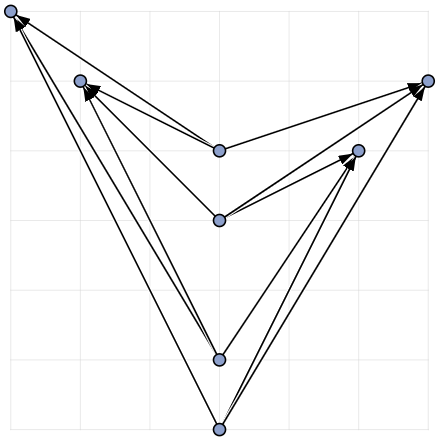
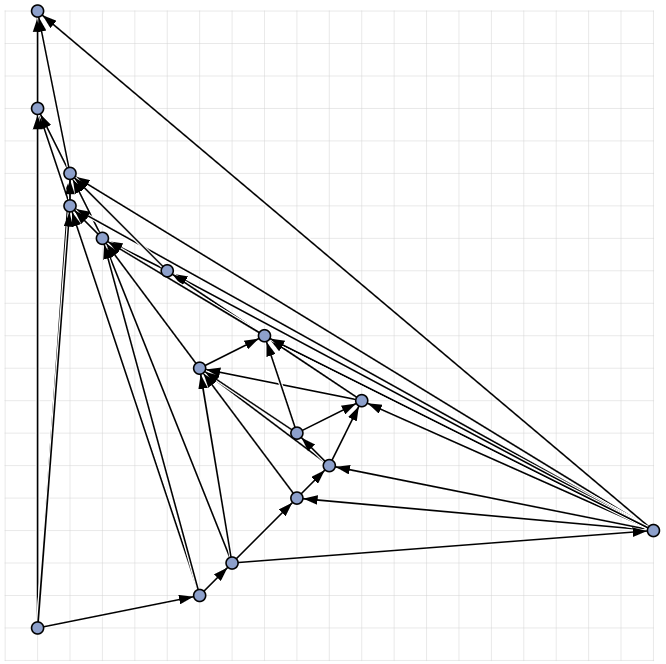
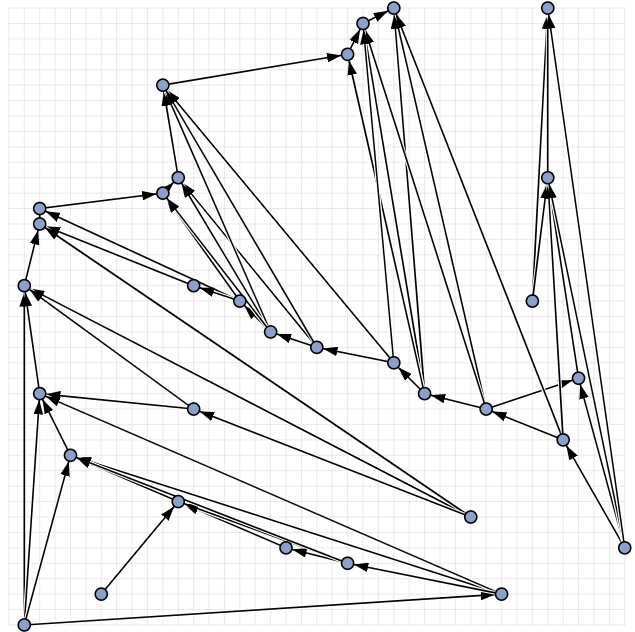
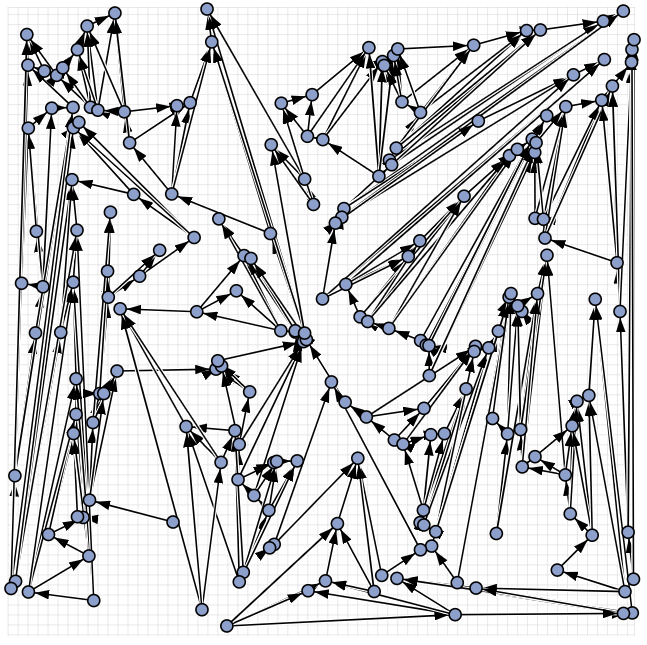
In the manual category, participants were presented with six graphs. We present the input layouts and the best manual submitted solutions (click on the images to download the input files).
problem 1: input
|
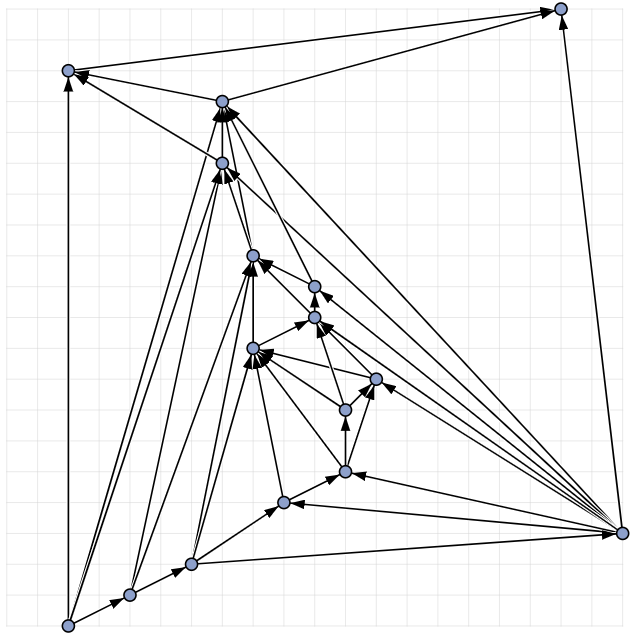
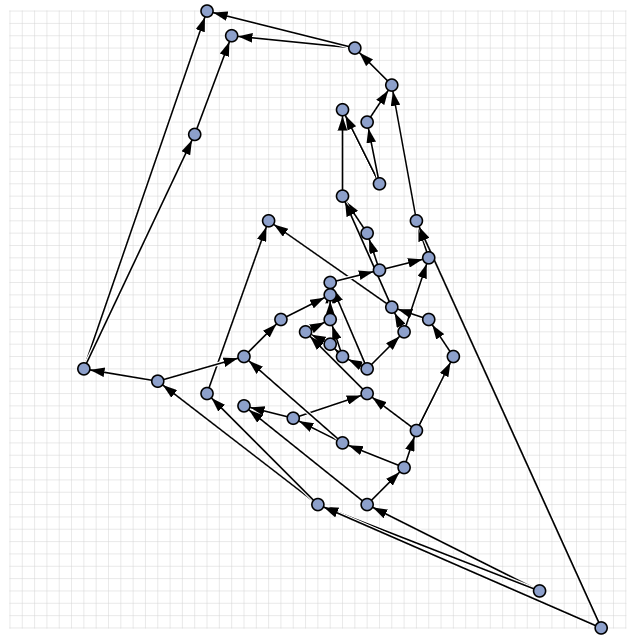
problem 1: best manual submission (Aaaaaah)
|
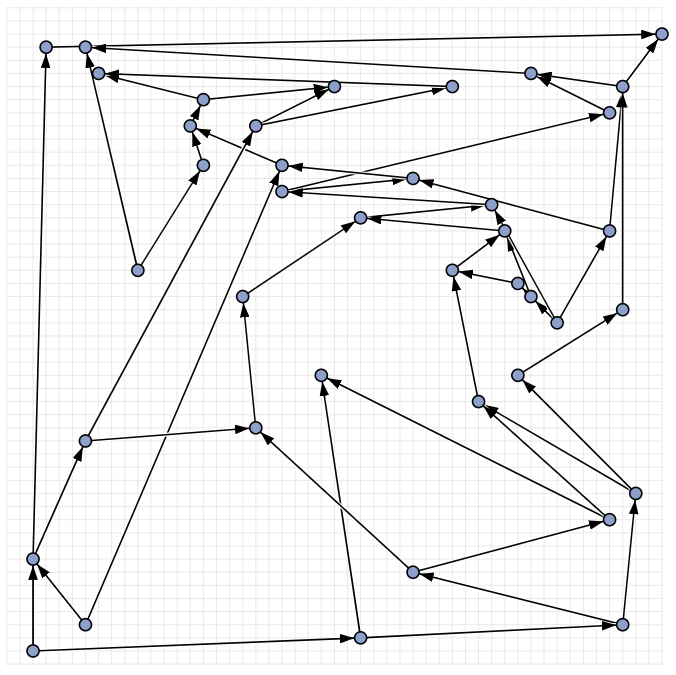
problem 2: input
|
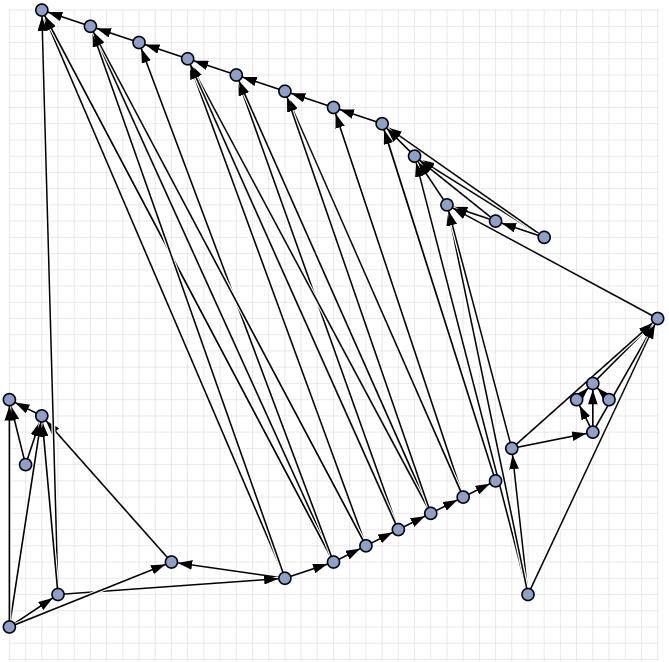
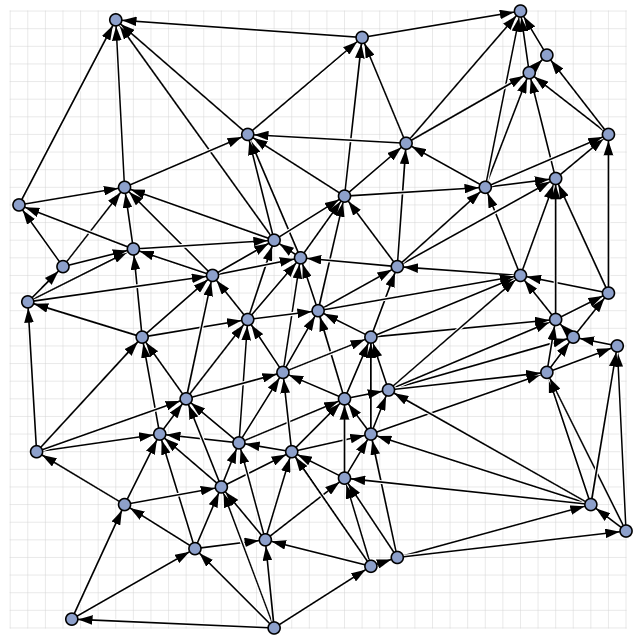
problem 2: best manual submission (36% Battery Remaining League)
|
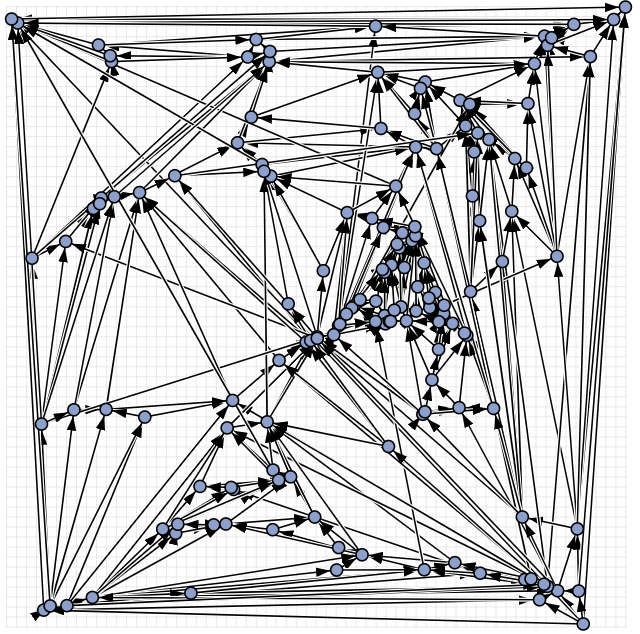
problem 3: input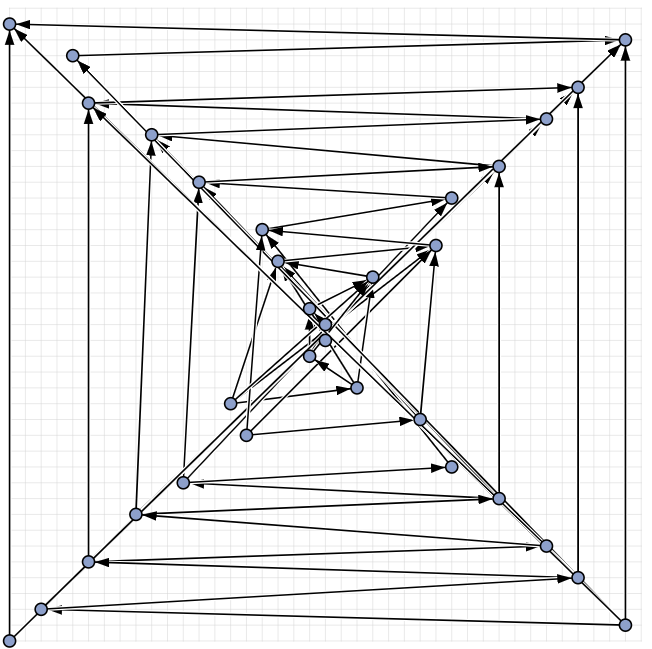
|
problem 3: best manual submission (Vertigo)
|
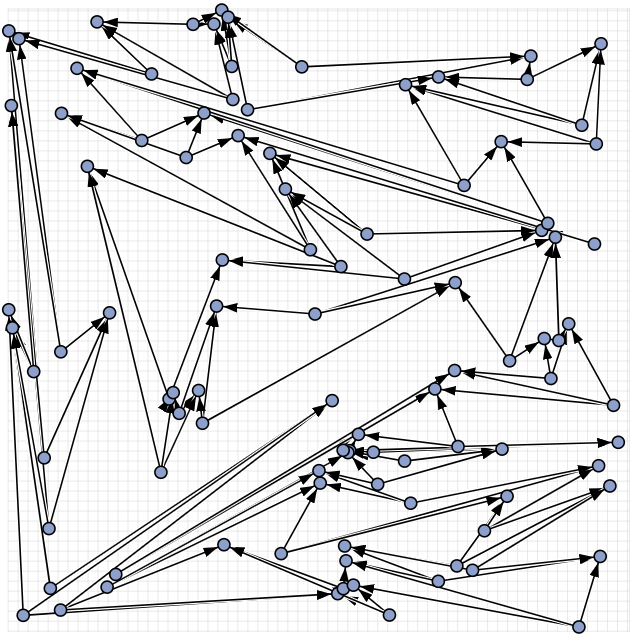
problem 4: input
|
problem 4: best manual submission (UpperCut)
|
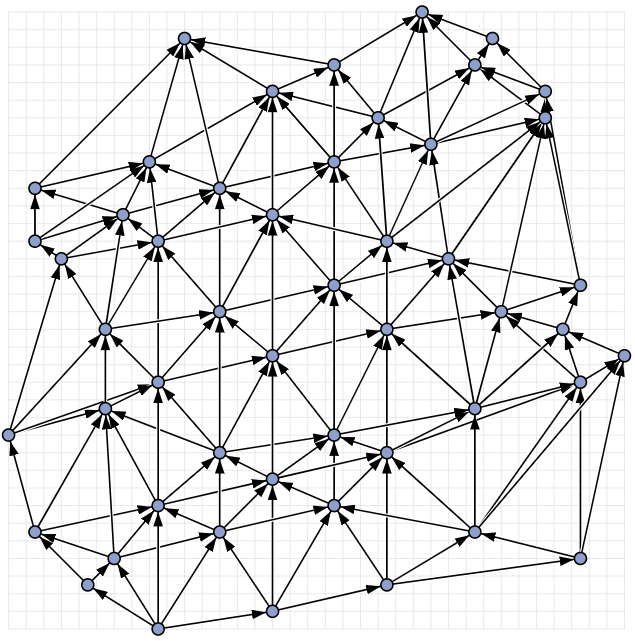
problem 5: input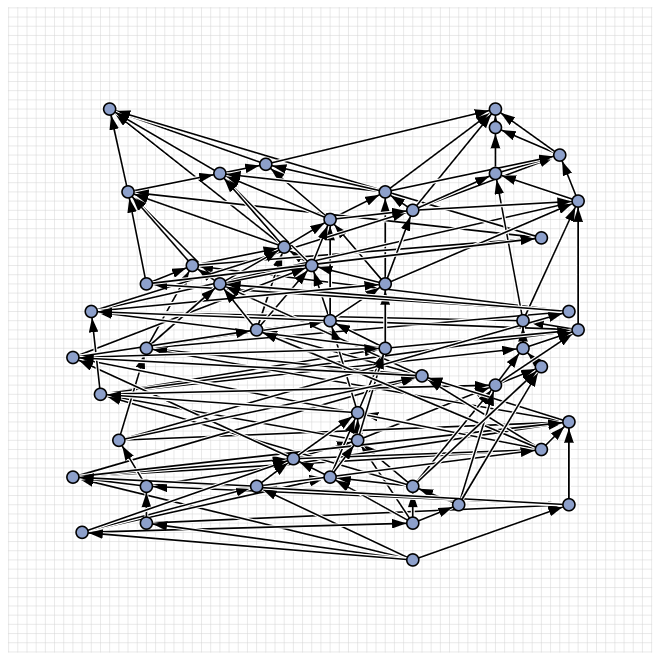
|
problem 5: best manual submission (Dinosaurs)
|
problem 6: input
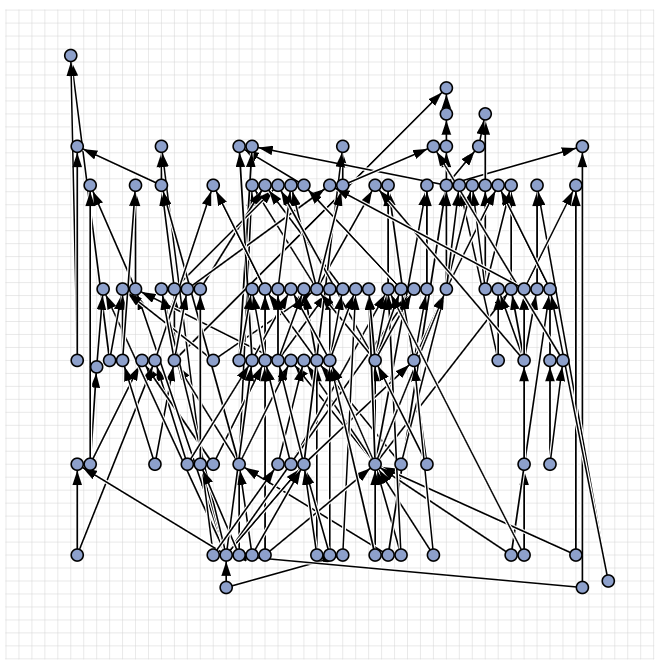
|
problem 6: best manual submission (Scho+)

|
We are happy to present the full list of scores for all teams. The numbers listed are the smallest crossing angle in degrees in each graph; the horizontal bars visualize the corresponding scores.
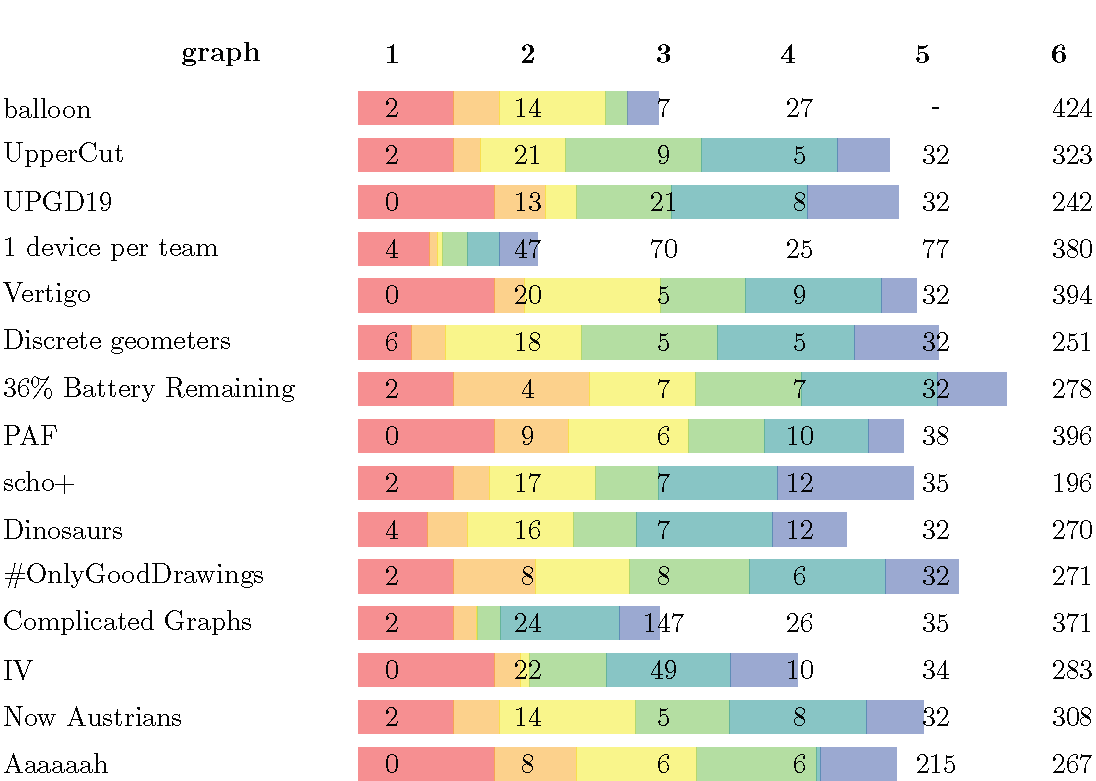
The third place team is team Discrete geometers, consisting of Jan Kyncl (Charles University in Prague) and Birgit Vogtenhuber (TU Graz).
The second place team is team #OnlyGoodCrossings, consisting of Fabrizio Montecchiani (University of Perugia), Luca Castelli Aleardi (École polytechnique), and Giacomo Ortali (University of Perugia).
The winning team is team 36% Battery Remaining League, consisting of Evmorvia Argyriou (yWorks), Henry Förster (University of Tübingen), and Martin Gronemann (University of Cologne)!
Martin Gronemann: For the manual contest, we followed first of all the basic rules that are independent of the problem to be solved. So at the beginning we submitted all instances right away with their initial layout to ensure that at the end we have a feasible entry for every instance. We started with the smaller instances in which we invested more time compared to the larger instances. For this particular problem, it was quite beneficial to try to figure out how these instances have been created. For example, while trying to untangle Instance 5, it became quickly evident that the underlying undirected graph is a 1-planar graph with a planar skeleton that resembles some kind of grid graph. This then led to a pattern that we used for the layout and we were quickly done with the second largest instance. The last and largest instance, however, was very difficult. After a "good" start trying to figure out the structure, we managed to increase the number of crossings from 448 to over 600 which forced us to start over. On the second try we simply followed a greedy approach as there were only 5 minutes and 40% of battery left.
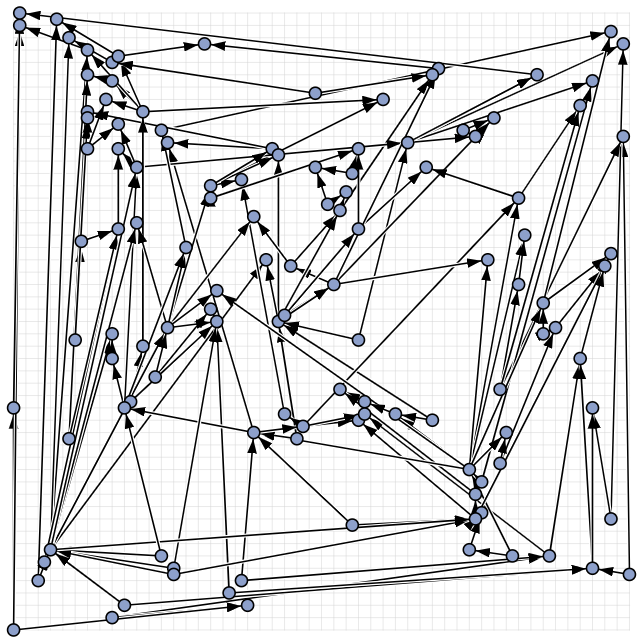
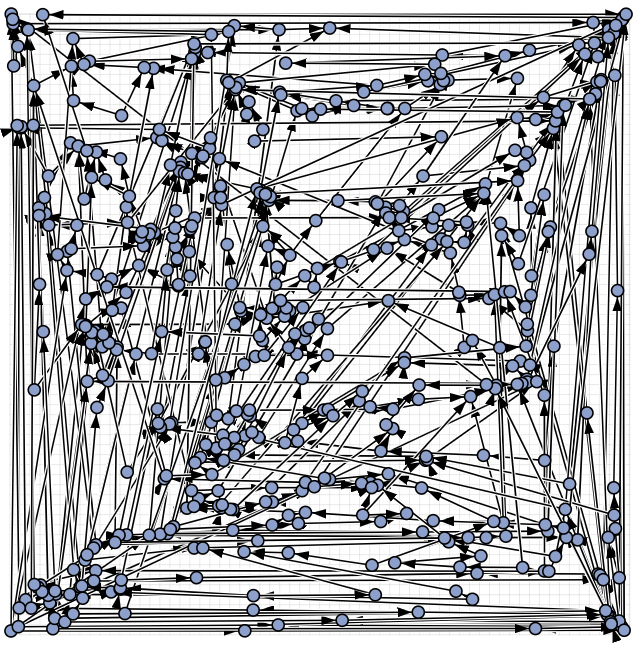
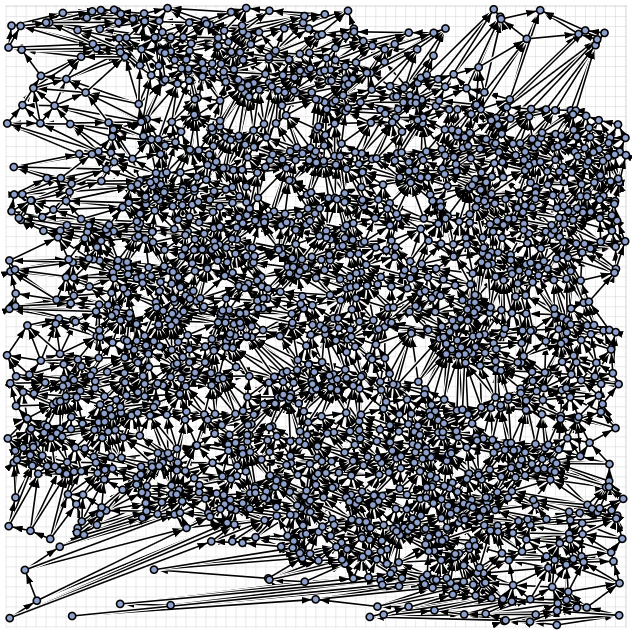
In the automatic category, the same six graphs as in the manual category had to be solved, and in addition another set of six larger graphs.
problem 1: best automatic submission (Tübingen-Bus)
|
problem 2: best automatic submission (Tübingen-Bus)
|
problem 3: best automatic submission (Tübingen-Bus)
|
problem 4: best automatic submission (Tübingen-Bus)
|
problem 5: best automatic submission (UoA)
|
problem 6: best automatic submission (Tübingen-Bus)
|
problem 7: input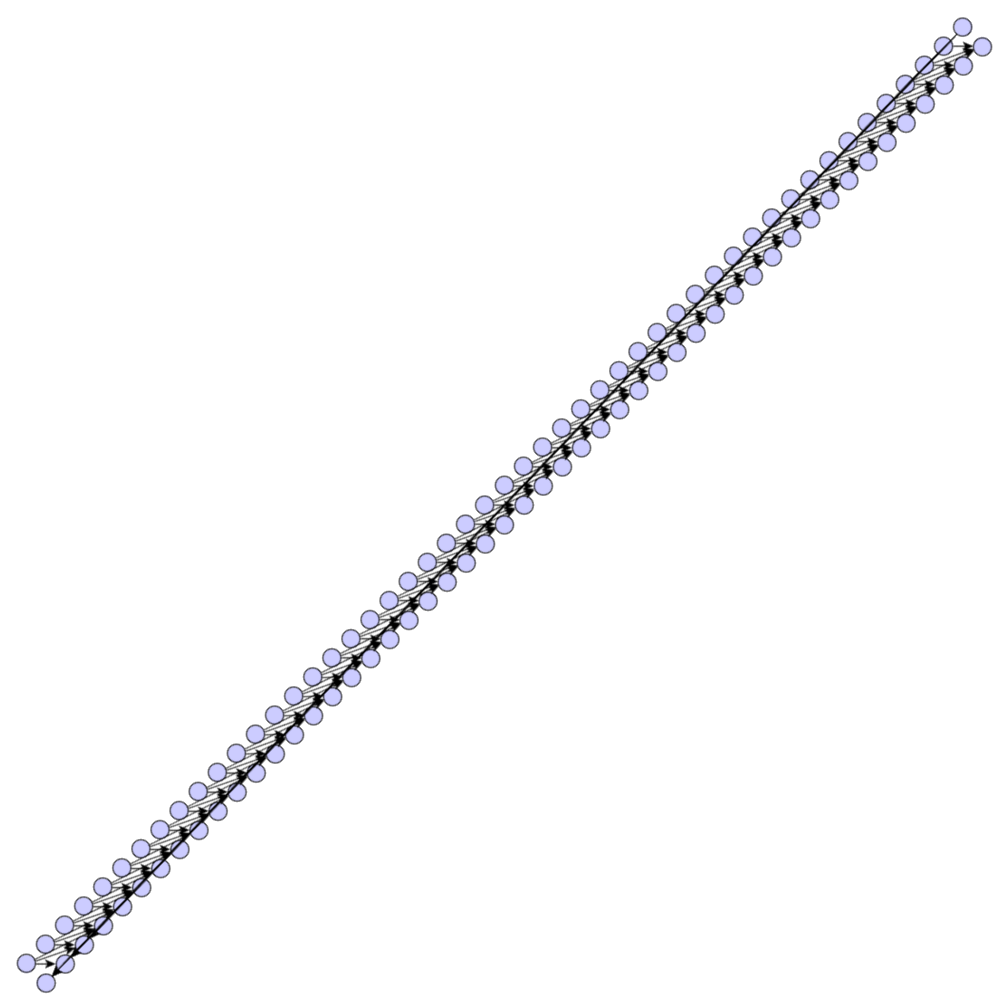
|
problem 7: best automatic submission (Tübingen-Bus)
|
problem 8: input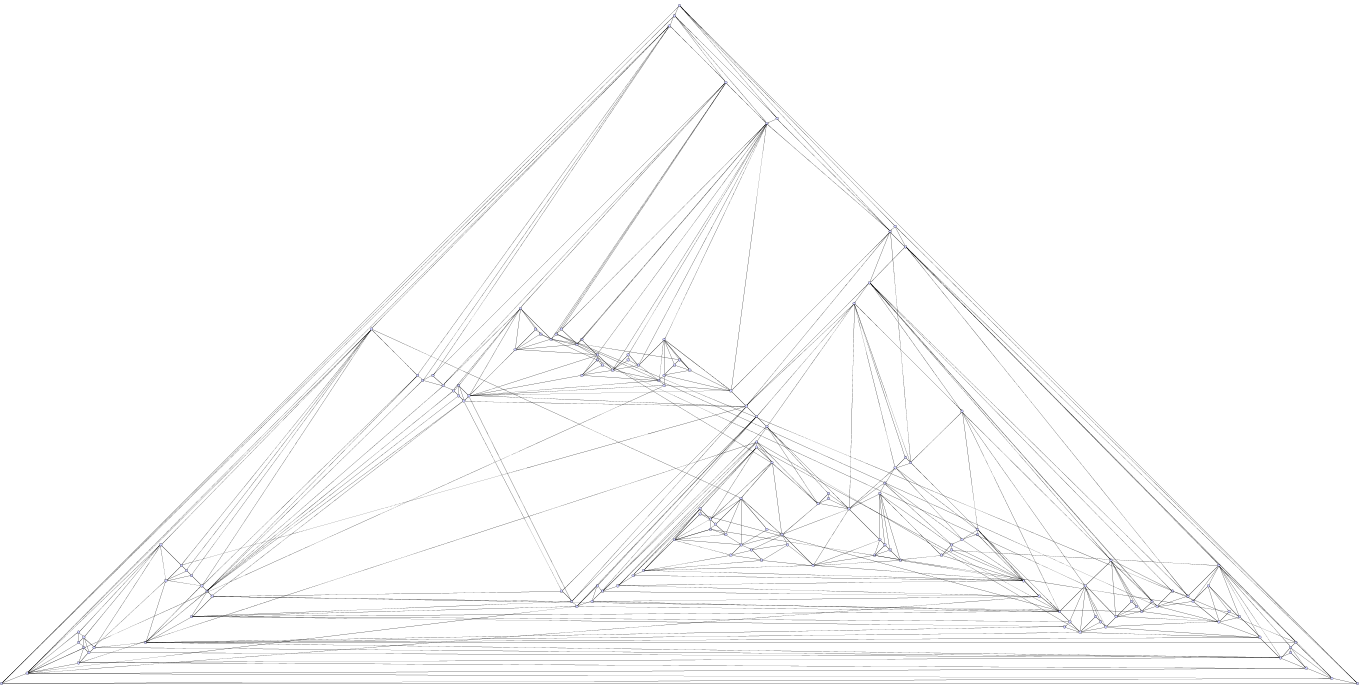
|
problem 8: best automatic submission (Tübingen-Bus)
|
problem 9: input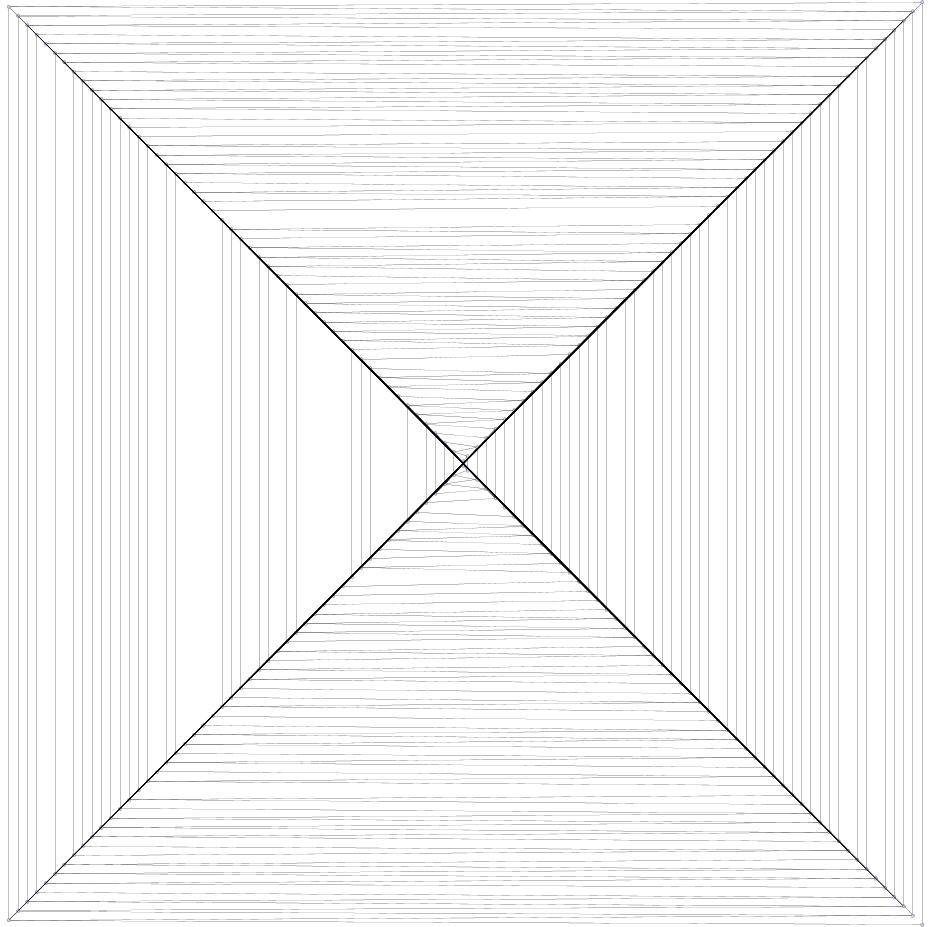
|
problem 9: best automatic submission (Tübingen-Bus)
|
problem 10: input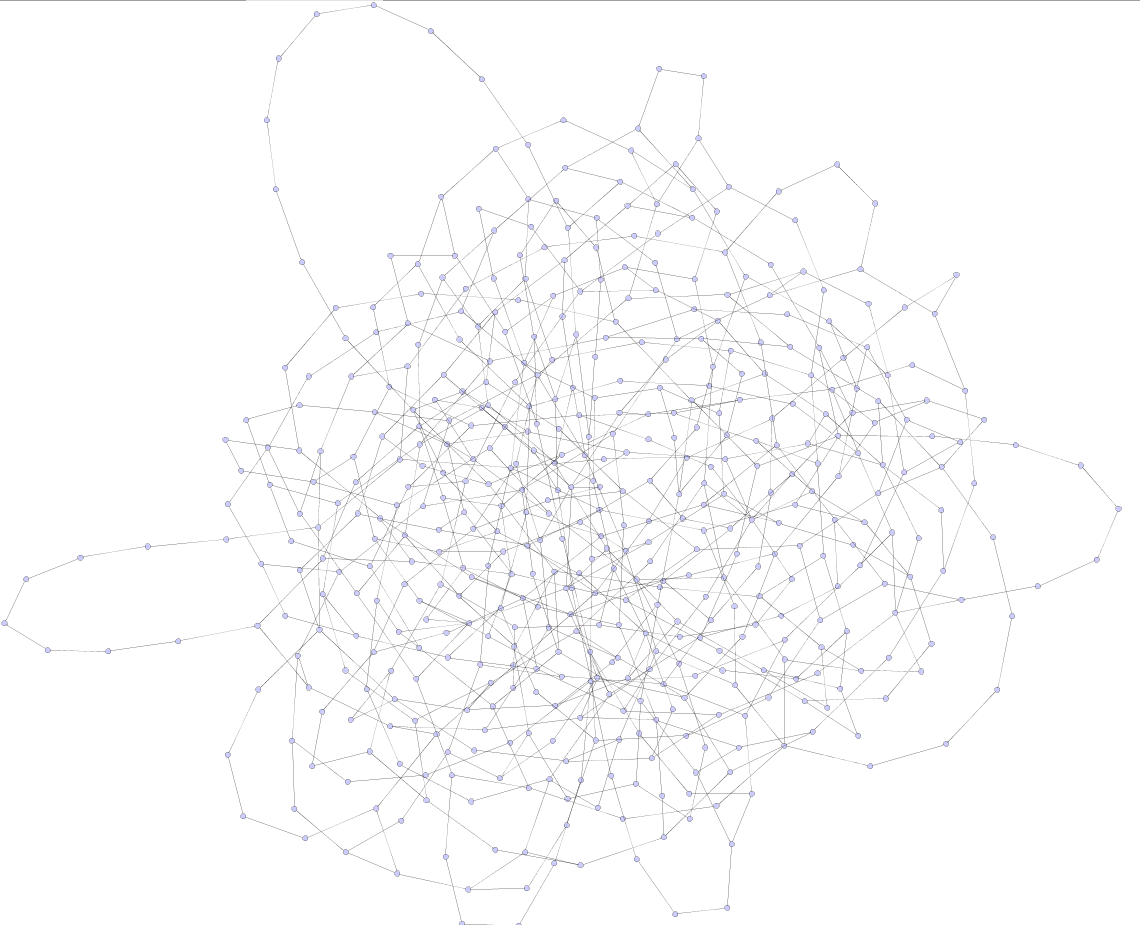
|
problem 10: best automatic submission (Tübingen-Bus)
|
problem 11: input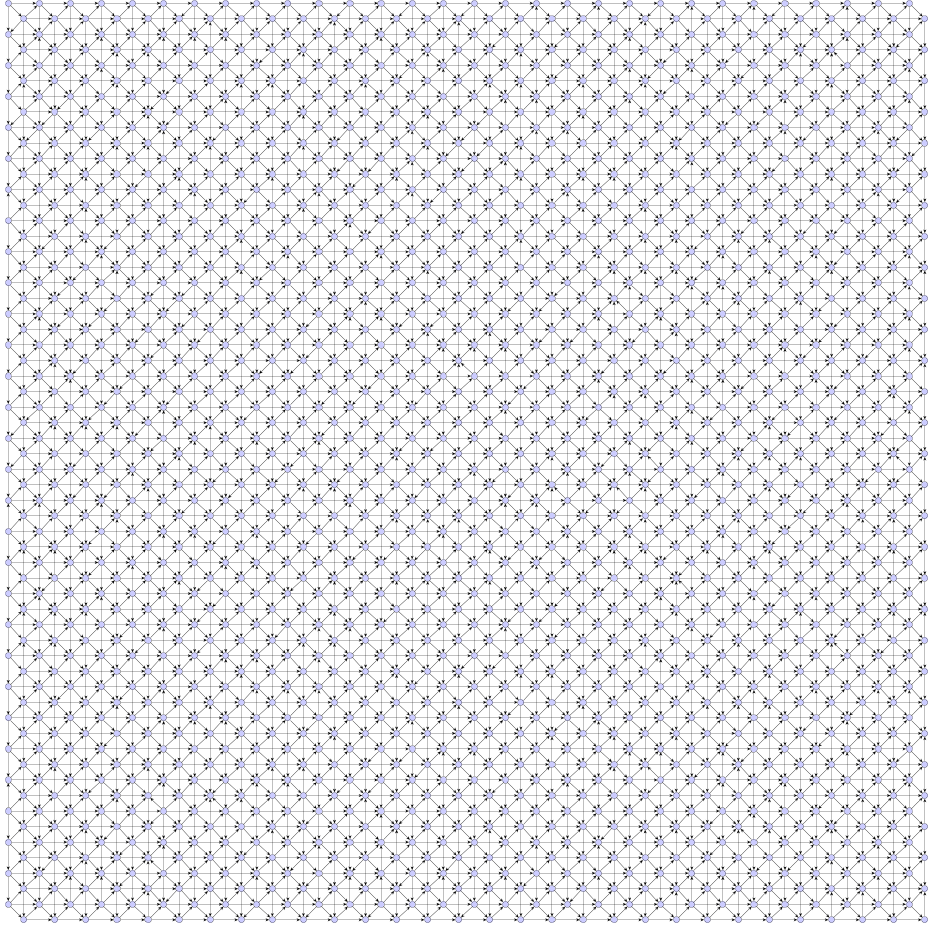
|
problem 11: best automatic submission (Tübingen-Bus)
|
problem 12: input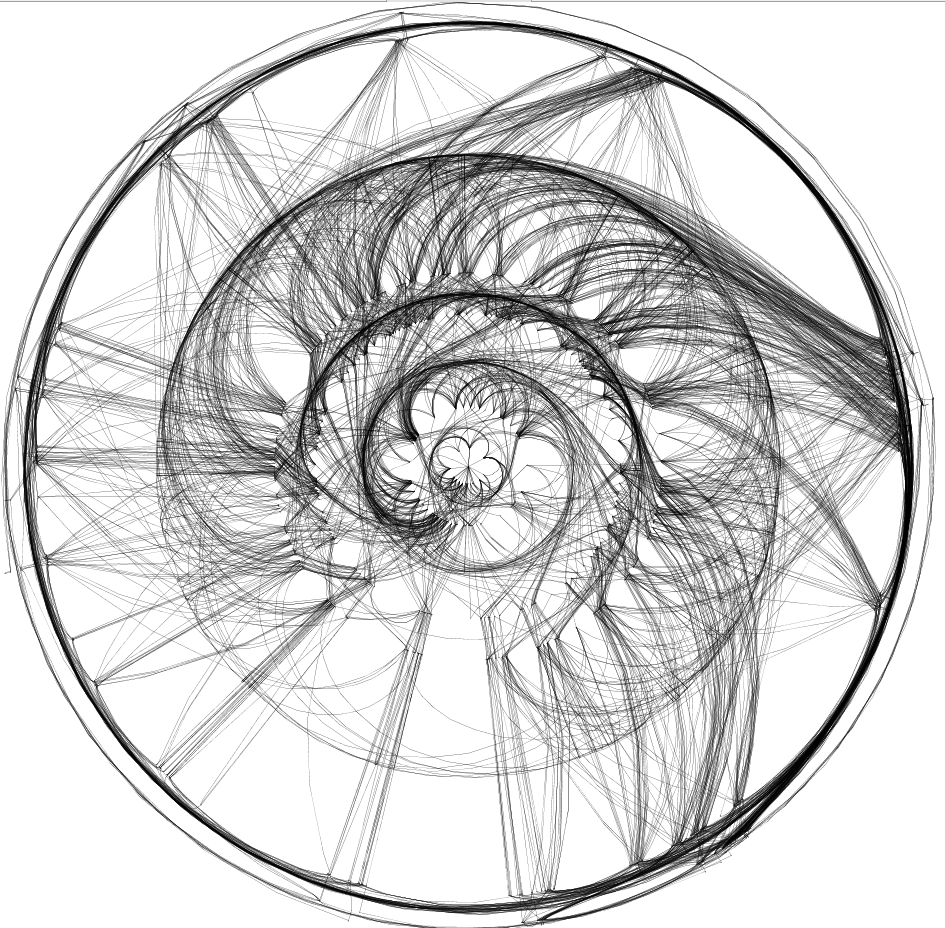
|
problem 12: best automatic submission (Tübingen-Bus)

|
Again, we are happy to present the full list of scores for all teams. The numbers listed are the smallest crossing angle in degrees in each graph; the horizontal bars visualize the corresponding scores.
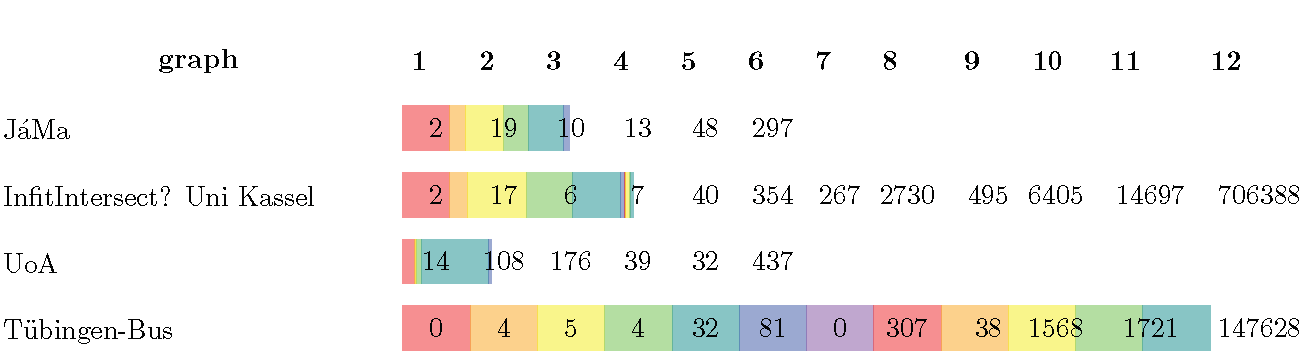
The third place team is team JáMa, consisting of Tomáš Masařík and Jana Novotná (Charles University in Prague).
The second place team is team InfitIntersect? Uni Kassel, consisting of Dominik Dürrschnabel, Jannik Raabe, Christoph Sandrock, and Joschka Wittich (University of Kassel).
The winning team is team Tübingen-Bus, consisting of Solveig Klepper, Axel Kuckuk, Paul Palomero Bernardo, Maximilian Pfister, Patrizio Angelini, Michalis Bekos, and Michael Kaufmann (University of Tübingen)!
Maximilian Pfister: We adopted a variant of the probabilistic hill-climbing method that gave us the first place last year, which we adjusted and optimized to the given task. The performed optimization made it even faster than the Tübingen-Bus that brought us to Prague. We are now looking forward to participate next year and defend our title.